
CASE STUDY:
Earth Economics:
Using design thinking and persuasive storytelling with economists
Earth Economics is a nonprofit world leader in natural capital valuation. Scientific and data-driven, Ecosystem Services Valuation provides insight to inform and inspire sustainable decisions that improve outcomes for people, businesses, communities, and natural resources.
I was the Lead User Experience Designer and Researcher and spent many hours with the economists and analysts observing and documenting complex workflows, then translated those findings into a simplified UI that supported analysis of data.
Our rallying cry was: How can we make this better than Excel?"
The problem
Ecosystems give us natural resources like clean water and air that we cannot live without. These naturally occurring benefits derived from an ecosystem are called ecosystem services. When an ecosystem service (such water filtration by a wetland) is lost, it must be replaced by mechanical means (such as a water treatment plant) if that service is to continue. Its replacement is often a new tax district and expensive new infrastructure.
Natural capital, which delivers ecosystem services, is made up of many land cover types such as forests, estuaries, oceans, grasslands, and even deserts. In the long run, preserving natural capital and the services it freely provides saves money, as built infrastructure usually costs more and inevitably breaks down over time.

How natural capital delivers ecosystem services
Ecosystem services, referred to as natural capital, are rarely valued in terms that can be entered into economic debates within national planning processes and, lacking visible value, they are often traded away for the proverbial song. If biodiversity and ecosystem services are to be incorporated into decision-making processes, they must be described in terms that decision makers can understand and use.
Biodiversity has intrinsic and cultural values beyond economics but to reach decision makers from all sectors and encourage them to account for natural capital, issues must be framed in terms of our main global indicator of value: money.
Valuations are based on multiple factors, including market price, avoided cost, replacement custom, income, “hedonic” pricing, travel cost, and contingent valuation. A wide variety of non-normalized data is used in the calculations, including private and public data sources, and GIS data. Benefit-transfer is a methodology to appraise natural capital in a similar way to house appraisals. Instead of looking for comparative sales to determine value, analysts look for comparative values in published studies.


Natural capital (such as healthy forests and oceans) versus built capital (such as water treatment plants and mechanical atmospheric CO2 removal)
The analysts were manually combining many sources of data into Excel spreadsheets and using pivot tables to gain insights. The problem with this was that there was no angle source of truth for a project, as team members tended to store and work on files locally, and often these elaborate Excel files weren’t accessible to other team members.
In terms of ecosystem valuation, these values are conveyed in terms of dollars per acre per year (or other major currencies, like euros). Failure to access robust data in assessments could result in a focus on “easier” to measure assets, rather than dealing with the real complexities of natural capital. It could also undermine the value of natural capital assessments as a decision-making tool.
There was a rudimentary web-based tool built by a small software team, but it was emergent in design without the benefit of user research and user experience design.
What big software development wins could we accomplish on a shoestring budget?
How could we encourage the analysts to move away from Excel, use the tool, and therefore continue to populate the system with data?
How could we monetize this data library and make it accessible to external partners so that it could help pay its development costs?


Excel sheets used by the analysts for benefit-transfer analysis and the original web-based Ecosystem Valuation Toolkit
The solution
The organically grown system needed to get systematized and centralized. I needed to work with the analysts and the software team to comprehensively analyze needs and workflows and design a central data repository and web-based tool that would allow for faster, easier valuation and report generation. This system should be secure and accessible by role type and have rollback functionality so that data was not lost or overwritten. As a stretch goal, we wanted to have the tool accessible to external partners who had the appropriate permissions.
My role
As lead user researcher, I had only a nominal understanding of this complex field. My first job was to perform formative research to find out what was most important to analysts, where their pain points were, what concerns they had, what their secret tricks were, and what would incentivize them to adopt the system that we built. I also asked them to tell me their likes and dislikes of using Excel, to which they were very, very attached.
I also needed to review the current tool and determine where it was not meeting the needs of the analysts and do a gap analysis of workflows and functionality. After reviewing all of the research, the system broke down into four areas:
EVT Datasets and Researcher’s Library: an ever-growing, searchable database of ecosystem service values collected from carefully vetted sources and managed by expert ecological economists.
EVT Reports: SERVES (Simple, Effective Resource for Valuing Ecosystem Services), a web-based tool for calculating ecosystem service values and performing natural capital appraisal.
EVT Custom Values: allowing the researchers and analysts to customize EVERYTHING while still keeping the product consistent.
EVT Transcription: allow the researchers and analysts to import any study, any format, any values in a consistent way.

Whiteboarding with the analysts: Personas

Whiteboarding with the analysts: EVT 3.0 features
With a minimal development team and limited nonprofit budgets, I needed to keep my recommendations simple yet improve upon the processes and workflows. I created personas for the different types of users and developed a set of common controls to keep the UI consistent and airy to better showcase the dense information being displayed.
One of the use cases I was working towards was analysts squinting into their screens late at night under a deadline. How could I design the system so that it was familiar to them, easy to use, yet still an improvement on the existing tool, and more importantly, better than Excel? I chose to design minimalist common controls that picked up cues of the original interface.

Card sorting

Card sorting
Persuasive storytelling for economists and analysts
I also did a lot of work on educating the organization about the power of storytelling, based in neuroscience, for successful grant-writing and landing projects. At the first ESP conference I attended in 2014, which is the biggest yearly gathering of ecosystem valuation practitioners, I noticed that even during the keynote speech no one was paying attention. People had flown from around the world to be there and they weren’t even interested in what the headliners had to say.

Participants at the annual 2014 ESP conference completely uninterested in the keynote speaker
The following year I developed and proposed a storytelling workshop for economists and academics on how to use the power of narrative to get grants and convince stakeholders. It was the first of its kind of workshop accepted by the organizers, and attendance was standing room only and spilling out into the hall. The founder and board recognized this, so I consulted with them on how to strengthen their own strategies.
I even used it to save the software budget: the Managing Director did not have a technical background and was generally skeptical of the tech team. So I helped the Director and the Senior Program Manager write a narrative around why the software schedule had to slip and be reconfigured from time to time, which of course required more budget.
I proposed the theme of Lewis and Clark: “We sought the Northwest Passage, and provisioned for a water journey. But we found no passage, and the hills were mountains,” followed by an overview of where we started and the current state of development. “We can see the Pacific from here,” followed by three increasing budget scenarios, “Reach the coast, build a fort,” “Abandon camp,” and “Build a new city on the coast.”
I did not do the visual design of the presentation but helped build out the metaphor for the entire presentation.

A slide from the “save the tech budget” Lewis & Clark-themed presentation

A slide from the “save the tech budget” Lewis & Clark-themed presentation
The moment I heard the Managing Director say, “I can’t imagine coming all this way and just giving up before we reach the ocean,” I knew we had saved the funding. Not only that, but we demonstrated how we could produce new revenue streams in a highly relatable way to our specific audience.
For the rest of my time at Earth Economics, the Lewis & Clark metaphor was used org-wide.
Additional design artifacts

User personas
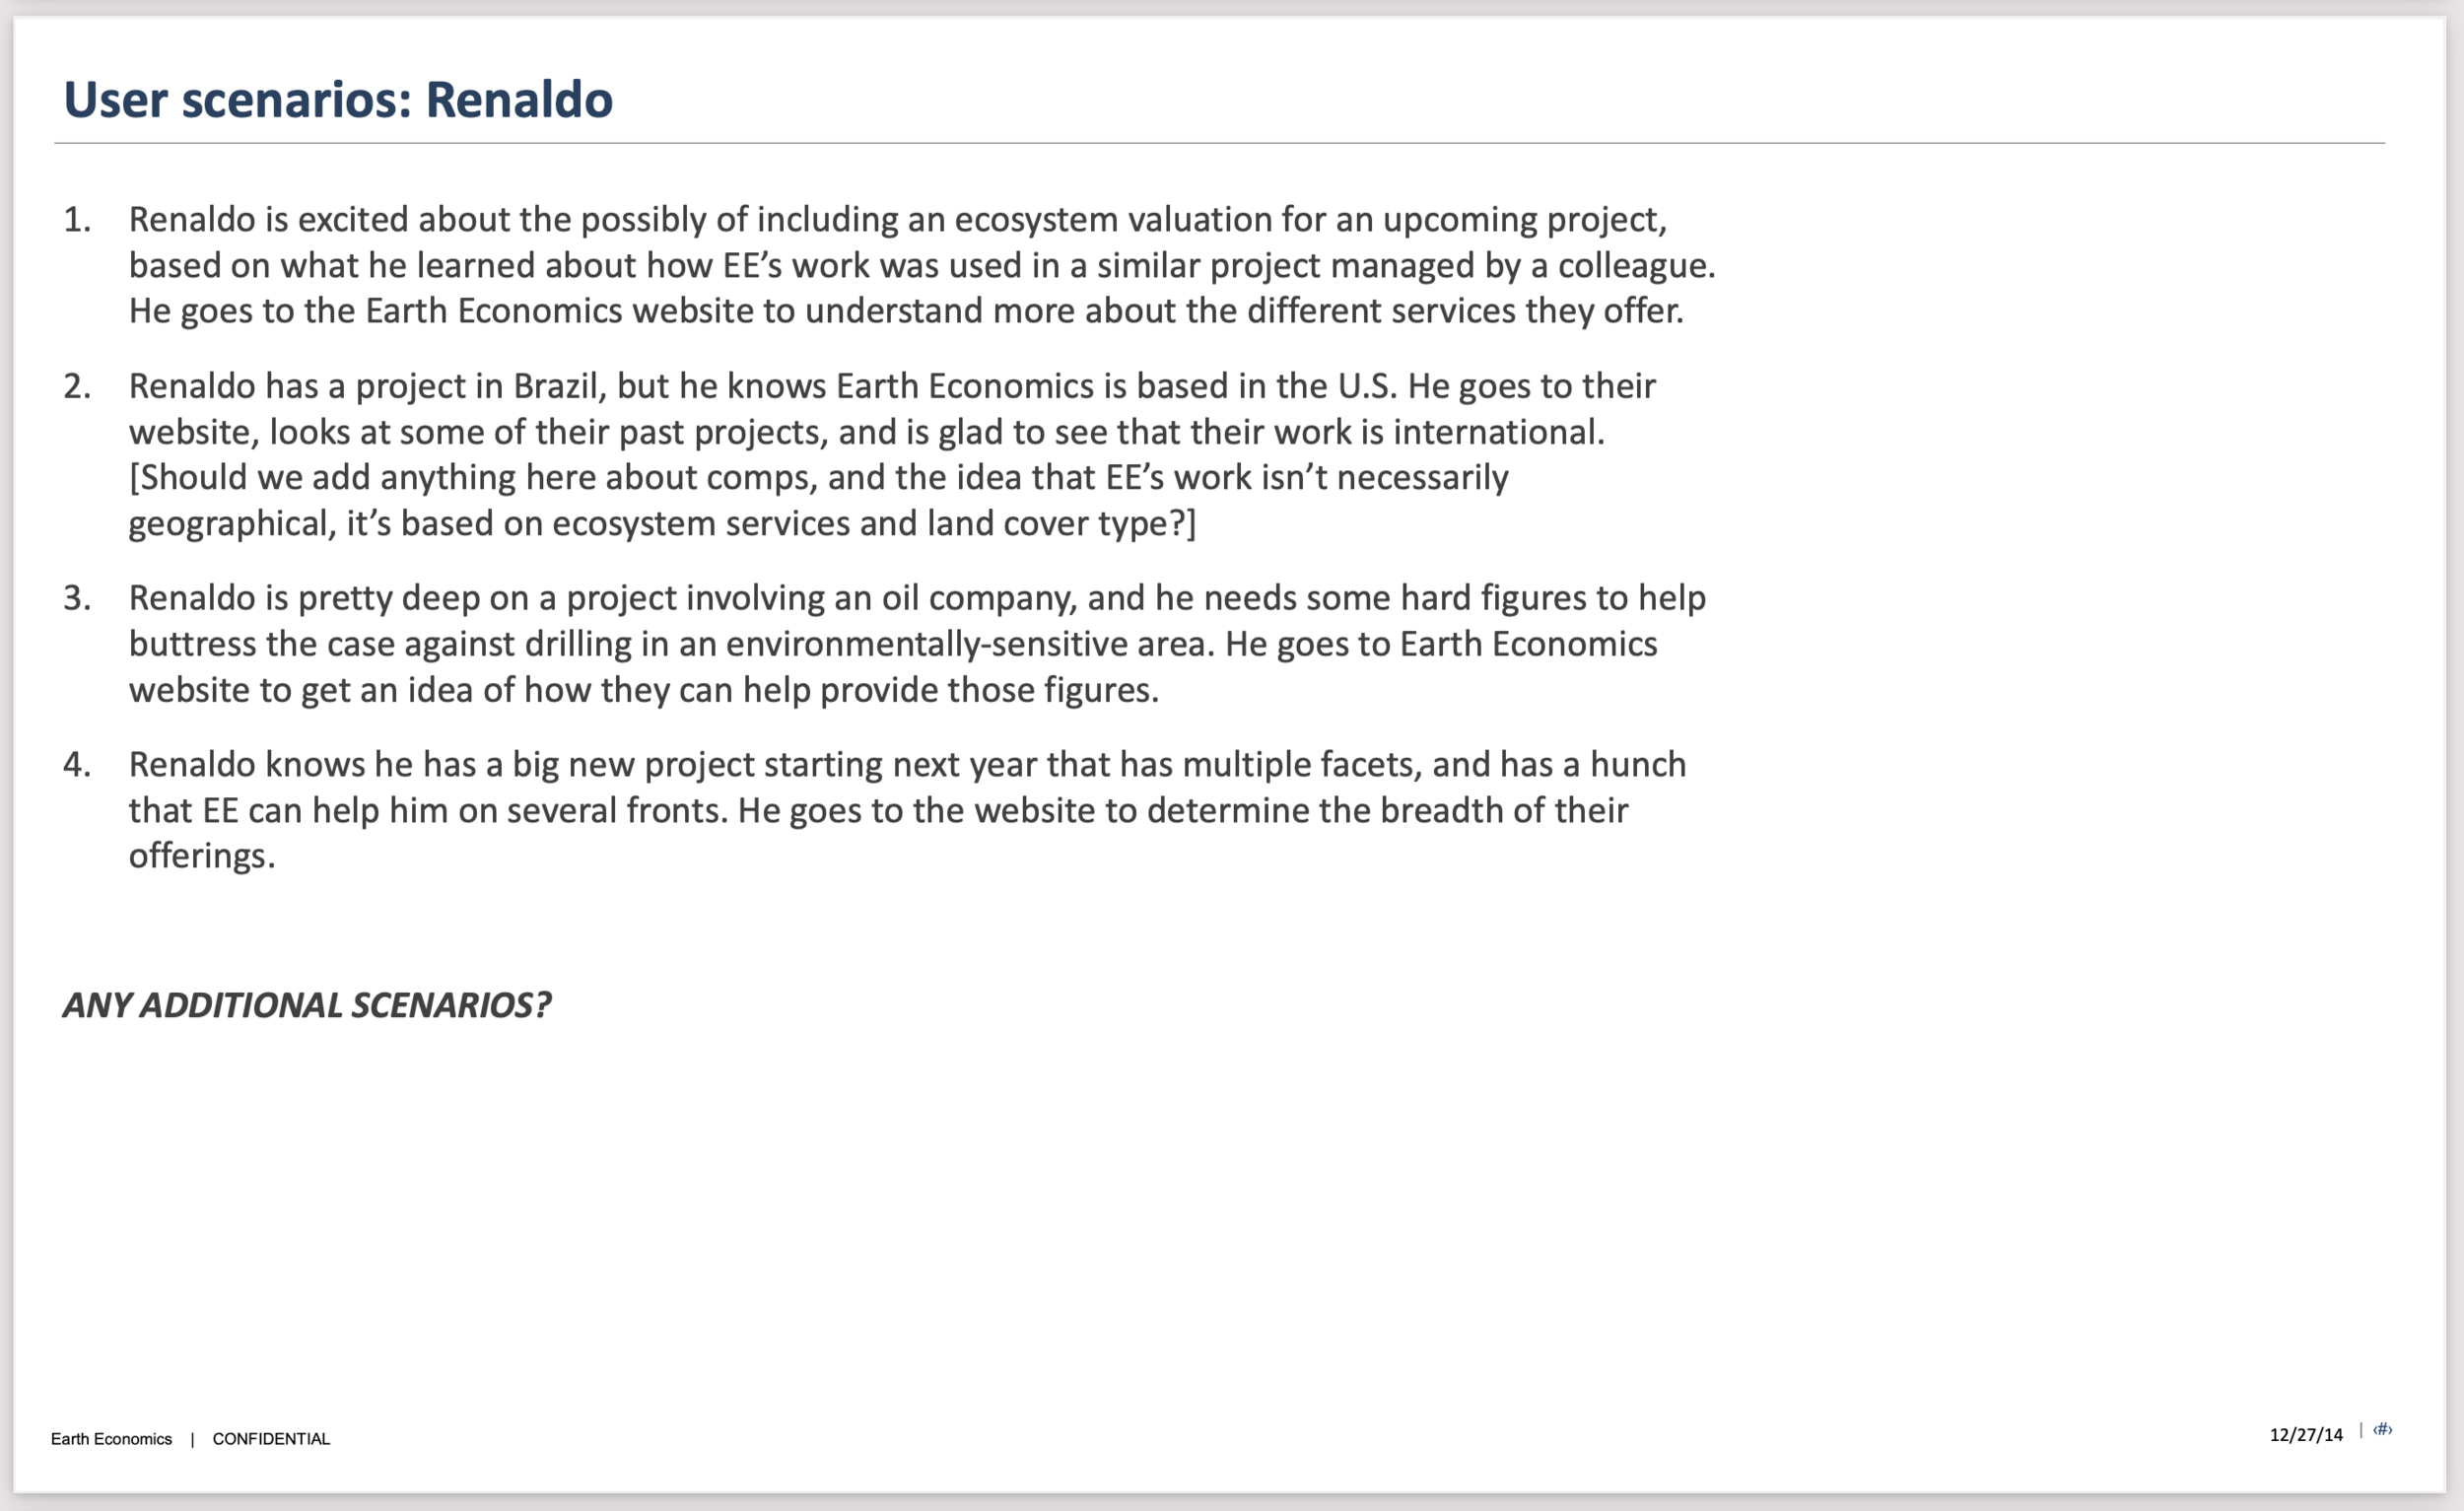
User personas

EVT interface screen: SERVES report

EVT interface screen: Ecosystem Descriptor groups

EVT interface screen: Attributes

EVT interface screen: Values
Processes and tools I use
Formative research, competitive research, stakeholder interviews, in-depth user interviews, contextual interviews, personas, card sorting, usability testing, Sketch wireframes, and narrative storytelling