
CASE STUDY:
Transparent Path:
Upgrading the food supply chain for perishables
Razor-thin margins. Paper records and fax machines. Records systems that were built 15-25 years ago. When foodborne illness triggers a recall, forensic research takes weeks or even months.
How can we trust our food? And how can we prevent $1 trillion of food sent directly from farms to landfills?
I am a co-founder and Director of a startup that will upgrade the supply system for high-value perishables with three technologies: secure IoT sensors, gathering clean product data and auditing it at the edge, powering predictive algorithms to anticipate supply chain issues before they happen.
The problem
The perishables supply chain is full of uncertainty. Exploding complexity. Changing regulations. Driver shortages. The perishables supply chain faces unprecedented pressures. But razor-thin margins have discouraged innovations that would lead to radical efficiencies and real-time resilience. You can’t manage what you can’t see. Faxes, emails, phone calls, and manual data entry won’t cut it. Transparent Path captures location and environmental conditions through storage and transit.
How do we get buy-in from potential partners and customers in the supply chain that is notorious for razor-thin margins and being risk-averse?
How do we keep supply chain partners connected and informed without giving away proprietary data and contract details?
What is the right user experience that allows producers, processors, and logistics companies to be proactive without causing unnecessary work and without being “just another dashboard” that feels like more noise?

Transparent Path end-to-end collaboration to reduce risk and loss
The solution
We avoid “garbage in, garbage out” data with secure industrial IoT sensors that continuously monitor and report location, temperature, and humidity at the pallet or case level. With a cooperative supply chain and shared origin, provenance, and environmental data, partners can work in concert to reduce risk. With access to this rich logistics and conditions data, our platform will intelligently predict issues like sourcing gaps, stockouts, equipment failures, and reputational risks — far in advance of them actually occurring.

Our first pilot with an apple producer in Michigan. The blue bubble represents acceptable route deviation. This driver went a bit afield at the end.
My role
As Director of Experience, my job is to deeply understand the complex food supply chain landscape, identity market opportunities and competitive advantages for Transparent Path, and present to the C-team. These briefs help guide company strategy. I also perform competitive research, write editorials, manage PR and social communications, and identify opportunities for strategic storytelling.
The core of my work is managing the experience design of the risk mitigation platform for client partners, a dashboard and alert system which gives prescriptive guidance during disruptions and identifies future risk prediction. I also consult with sales and product support on how to onboard and support customers, and how best to achieve partner compliance with our sensor technology to assure uninterrupted IoT data.
I have managed and mentored five General Assembly User Experience cohorts who have done much of the work on user interviews, card sorting, journey mapping, and wireframing.
Working with the Director of Development, we have built an interim dashboard that will be used in our upcoming pilot, scheduled for an initial round of user testing in early 2021.

Interviewing food producers at local farmer’s markets
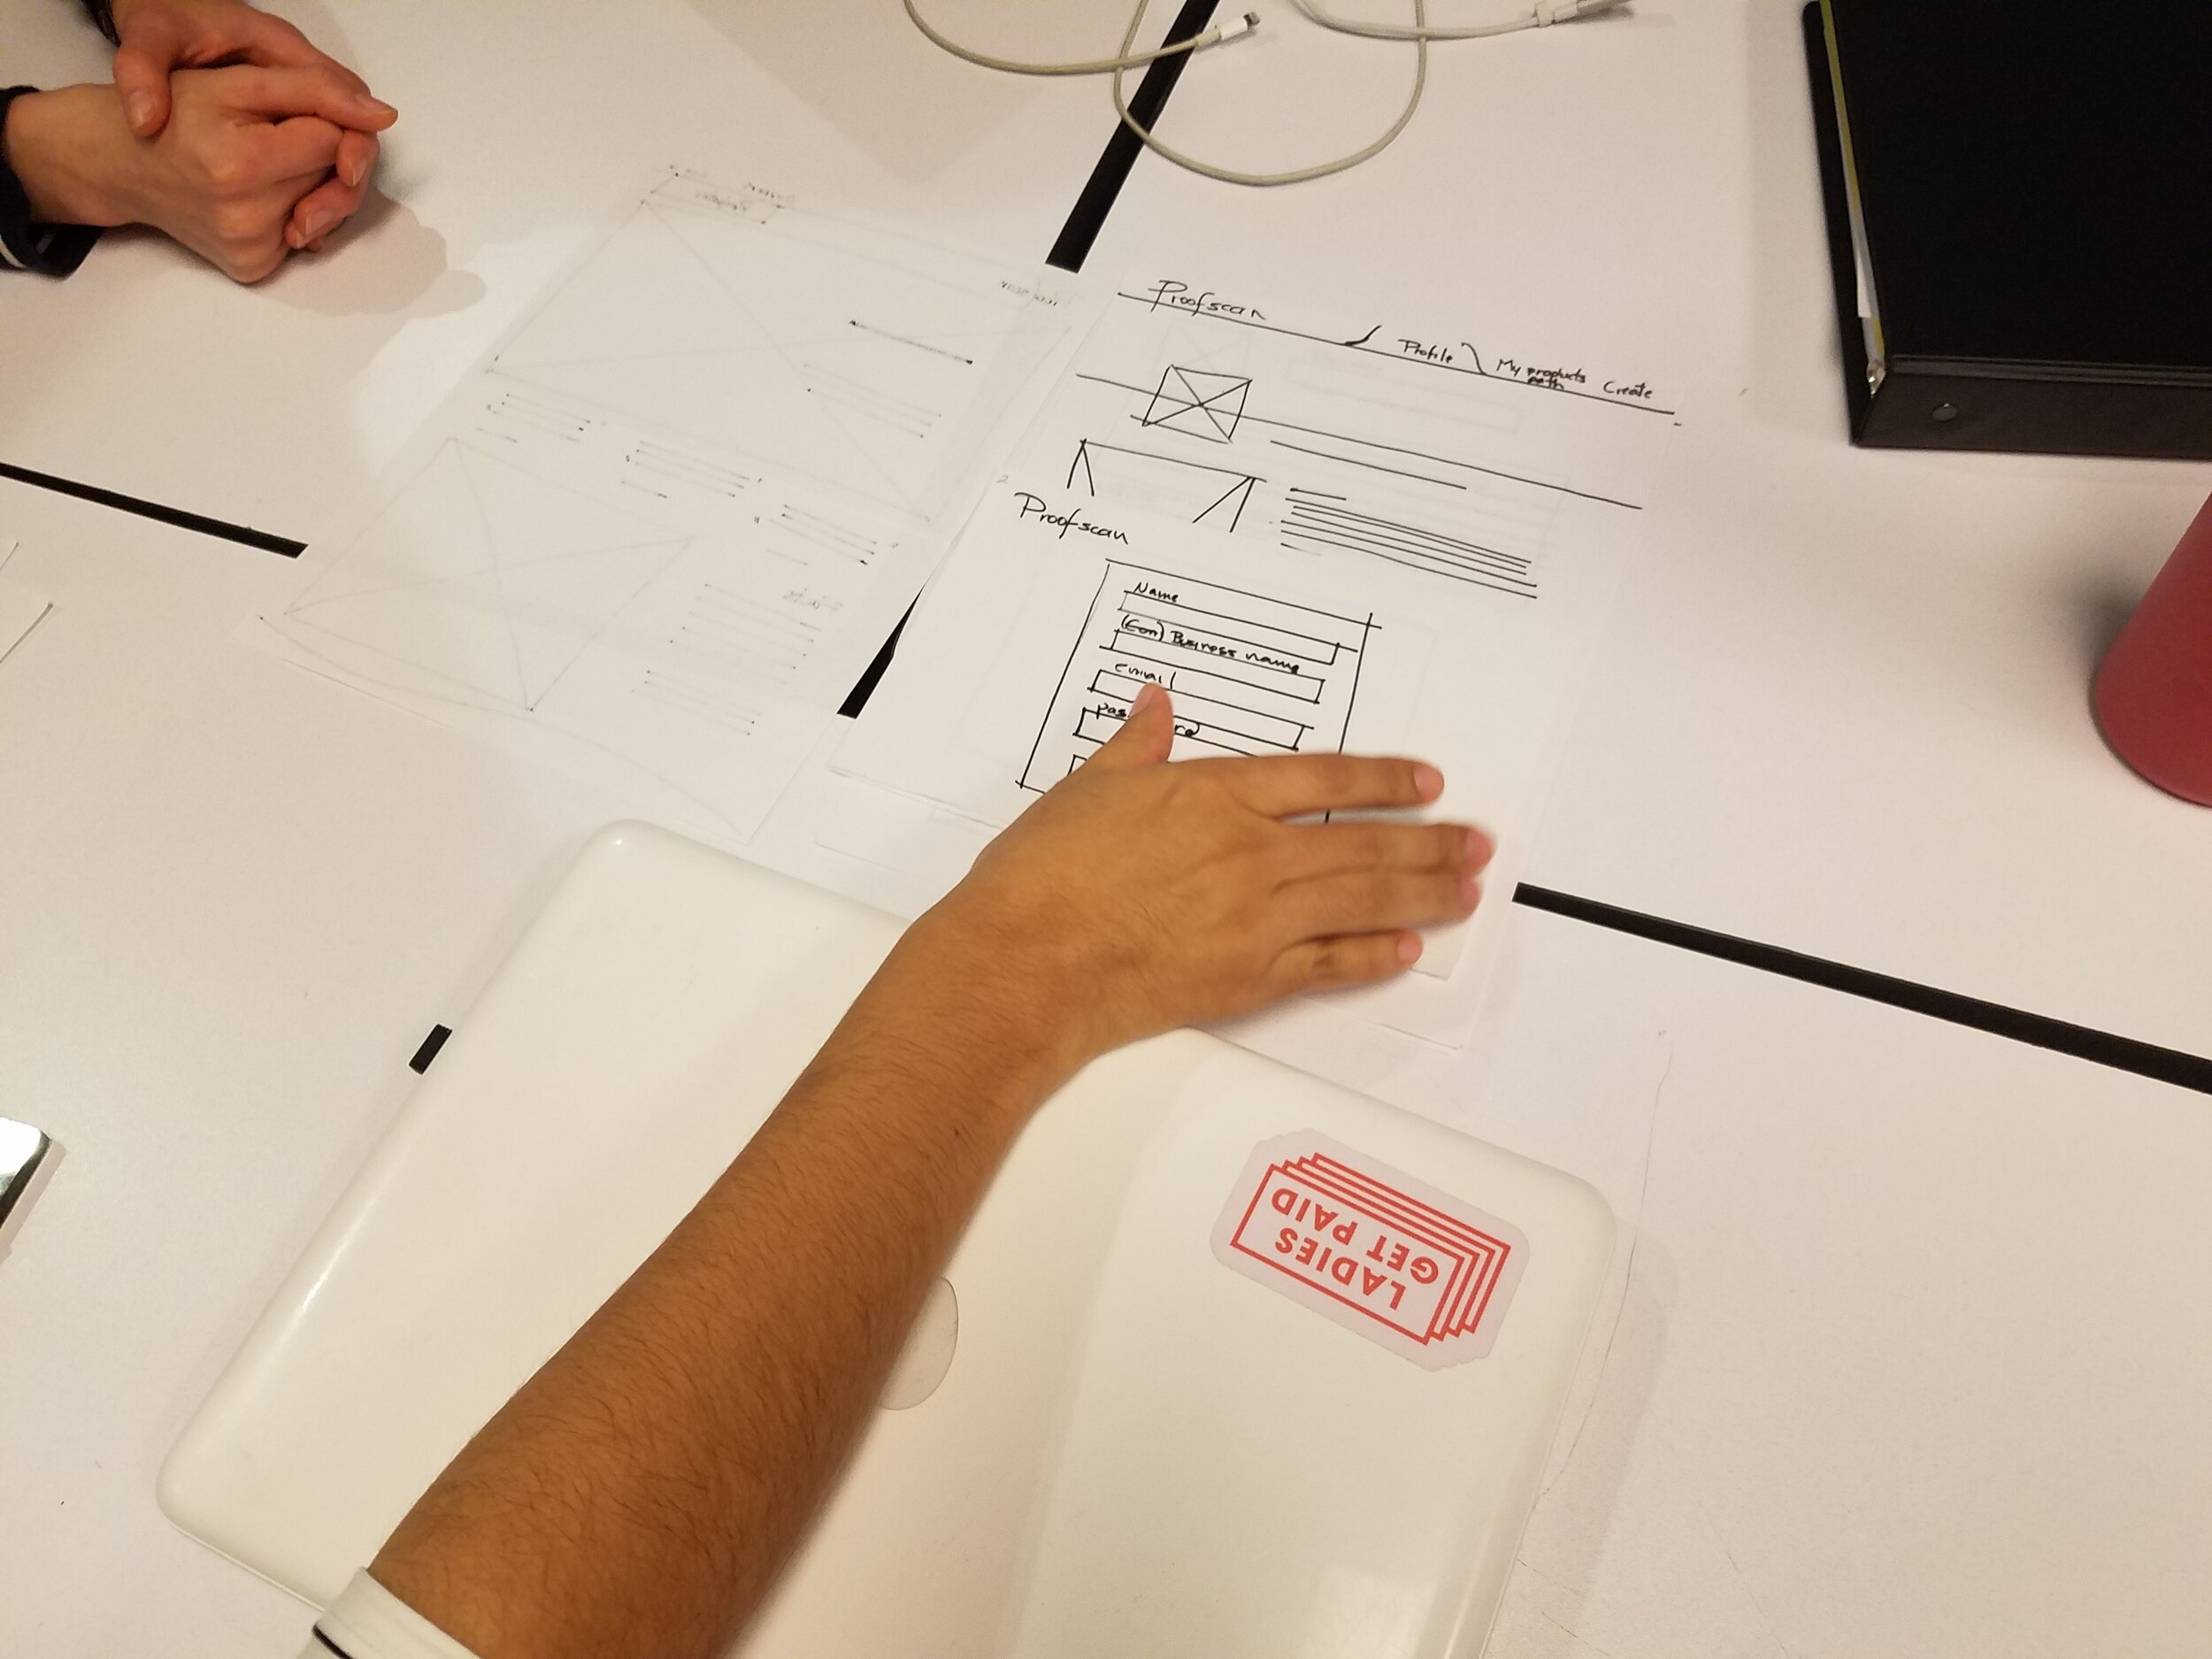
Paper prototype user testing
Additional design artifacts

User flow for the chocolate supply chain from the fourth General Assembly cohort
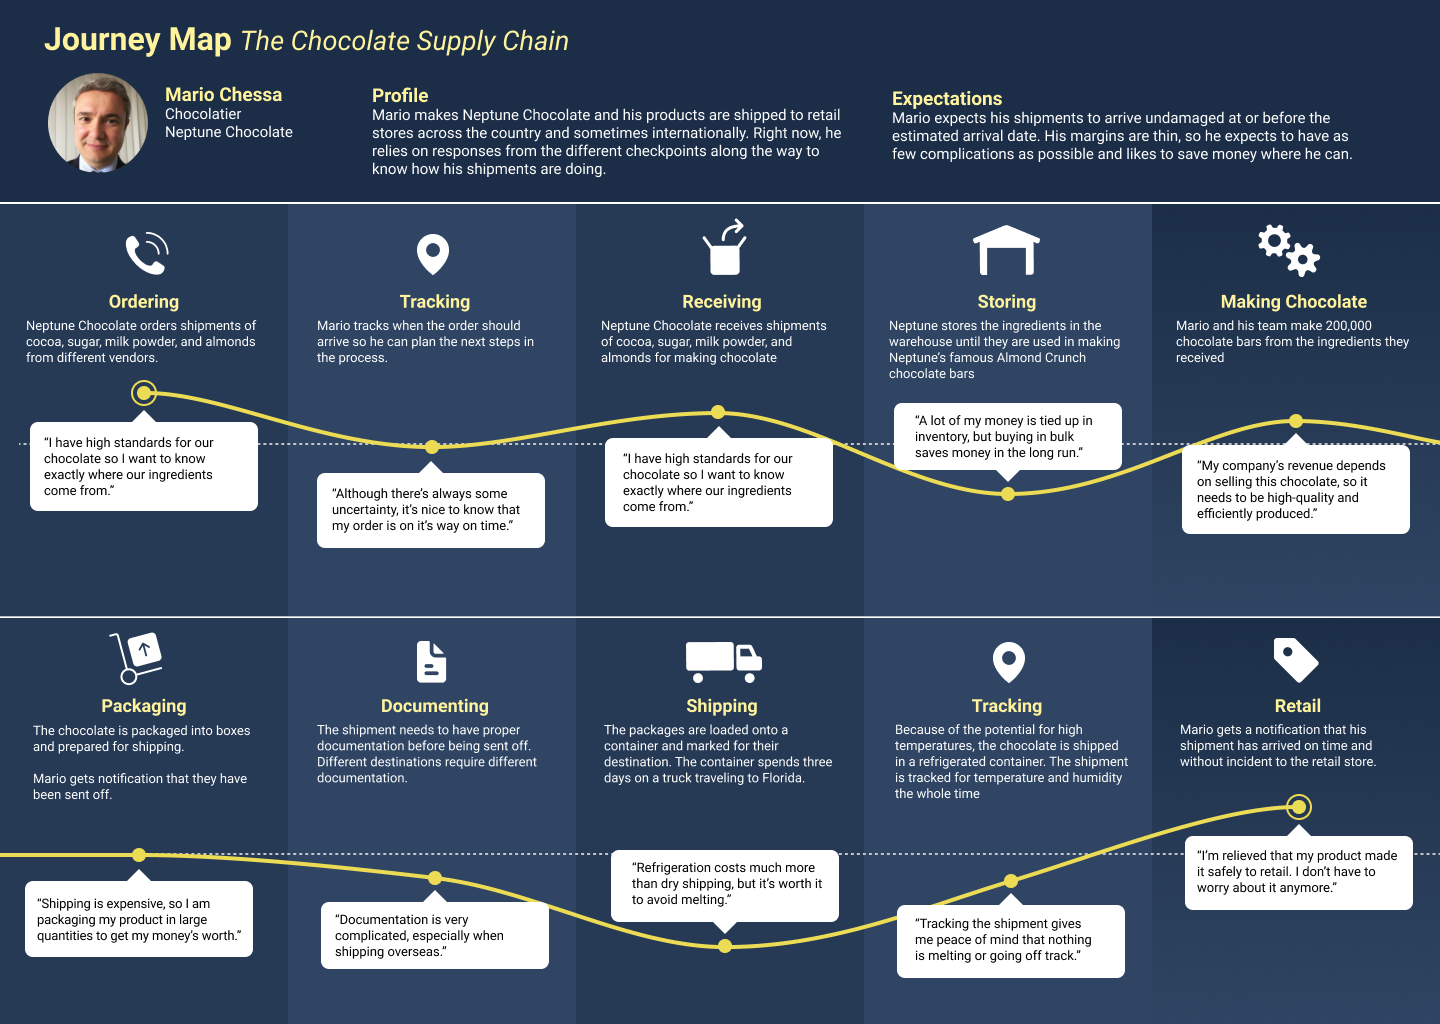
Journey map for the chocolate supply chain from the fourth General Assembly cohort

Journey map for alerts from the fifth General Assembly cohort

Journey map for alerts from the fifth General Assembly cohort

Wireframes for the risk mitigation platform dashboard from the third General Assembly cohort
Wireframes for real-time tracking on the platform dashboard from the third General Assembly cohort
Processes and tools I use
Formative research, competitive research, stakeholder interviews, in-depth user interviews, contextual interviews, surveys, personas, card sorting, usability testing, Sketch wireframes, and Figma low fidelity prototypes